Boost your data to the next level
Real time data collection, analysis and statistical process control software designed to support manufacturing and GxP organisations

End to end digital data toolbox
Tried and tested tools, optimised for smart manufacturing and engineered by industry practitioners
Visualize data as it's generated, allowing immediate detection of trends, outliers, and potential issues. Empower your team to maintain optimal process conditions, minimize variability, and ensure quality.
Feature showcase
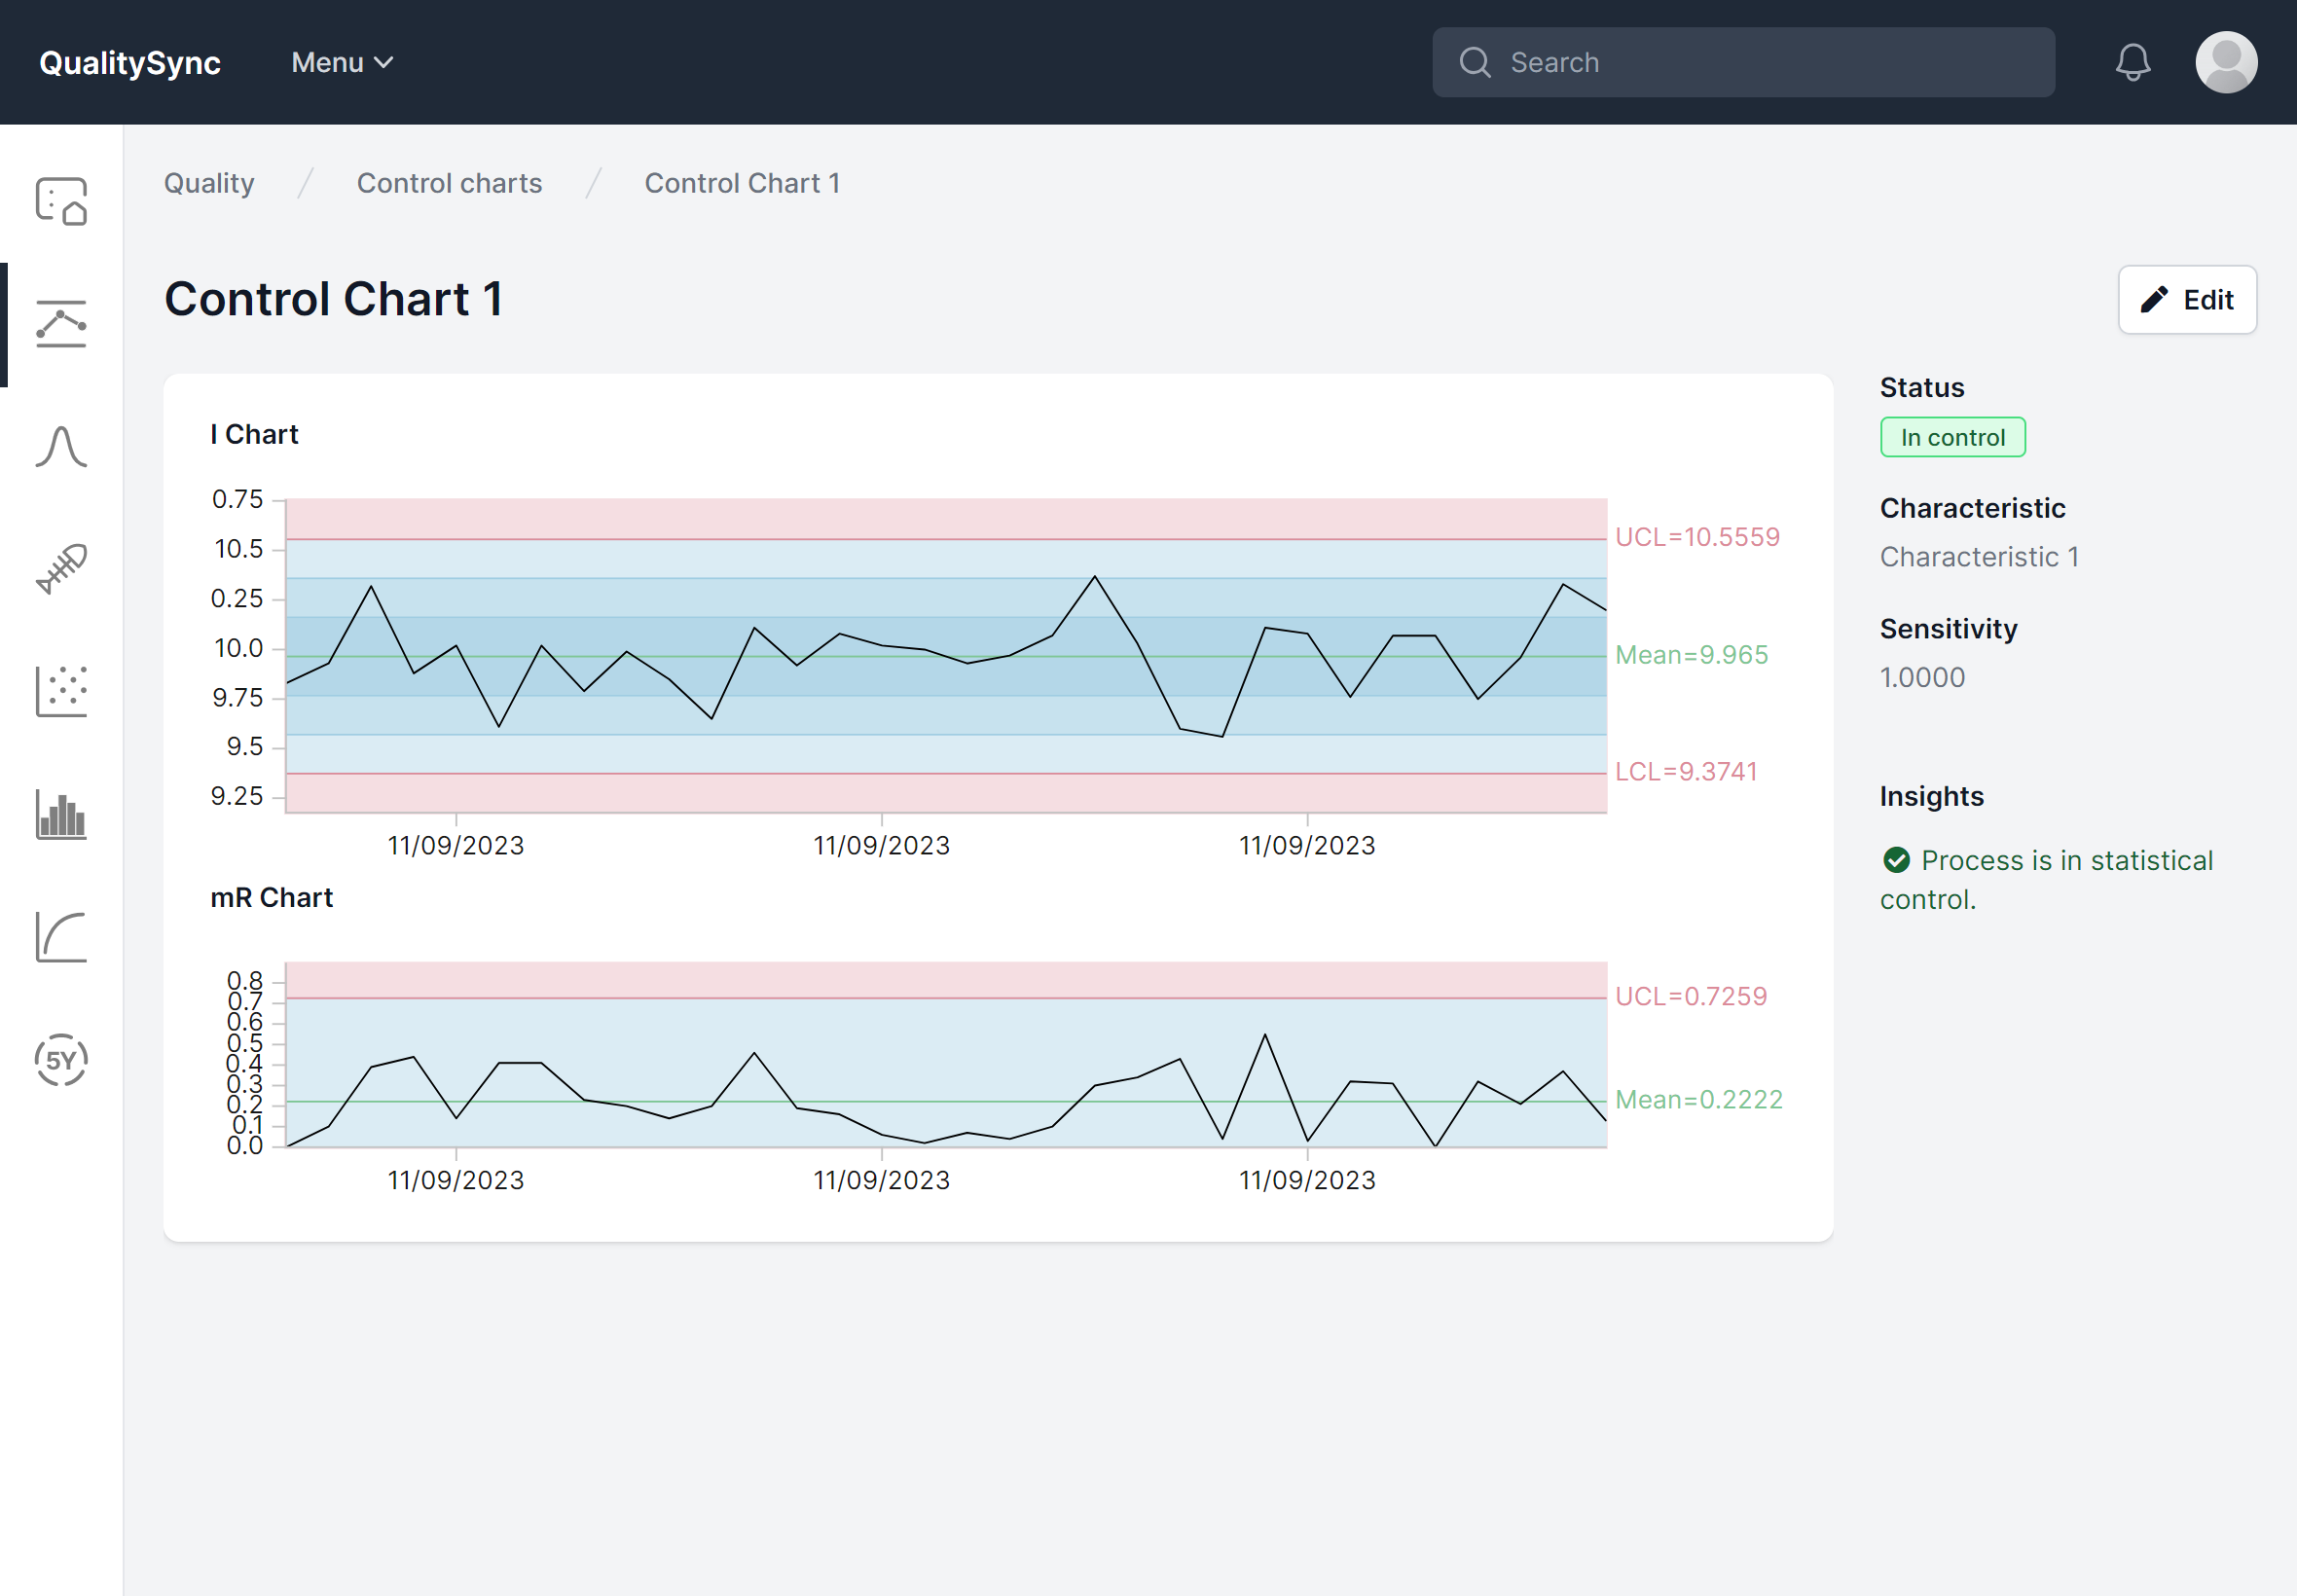
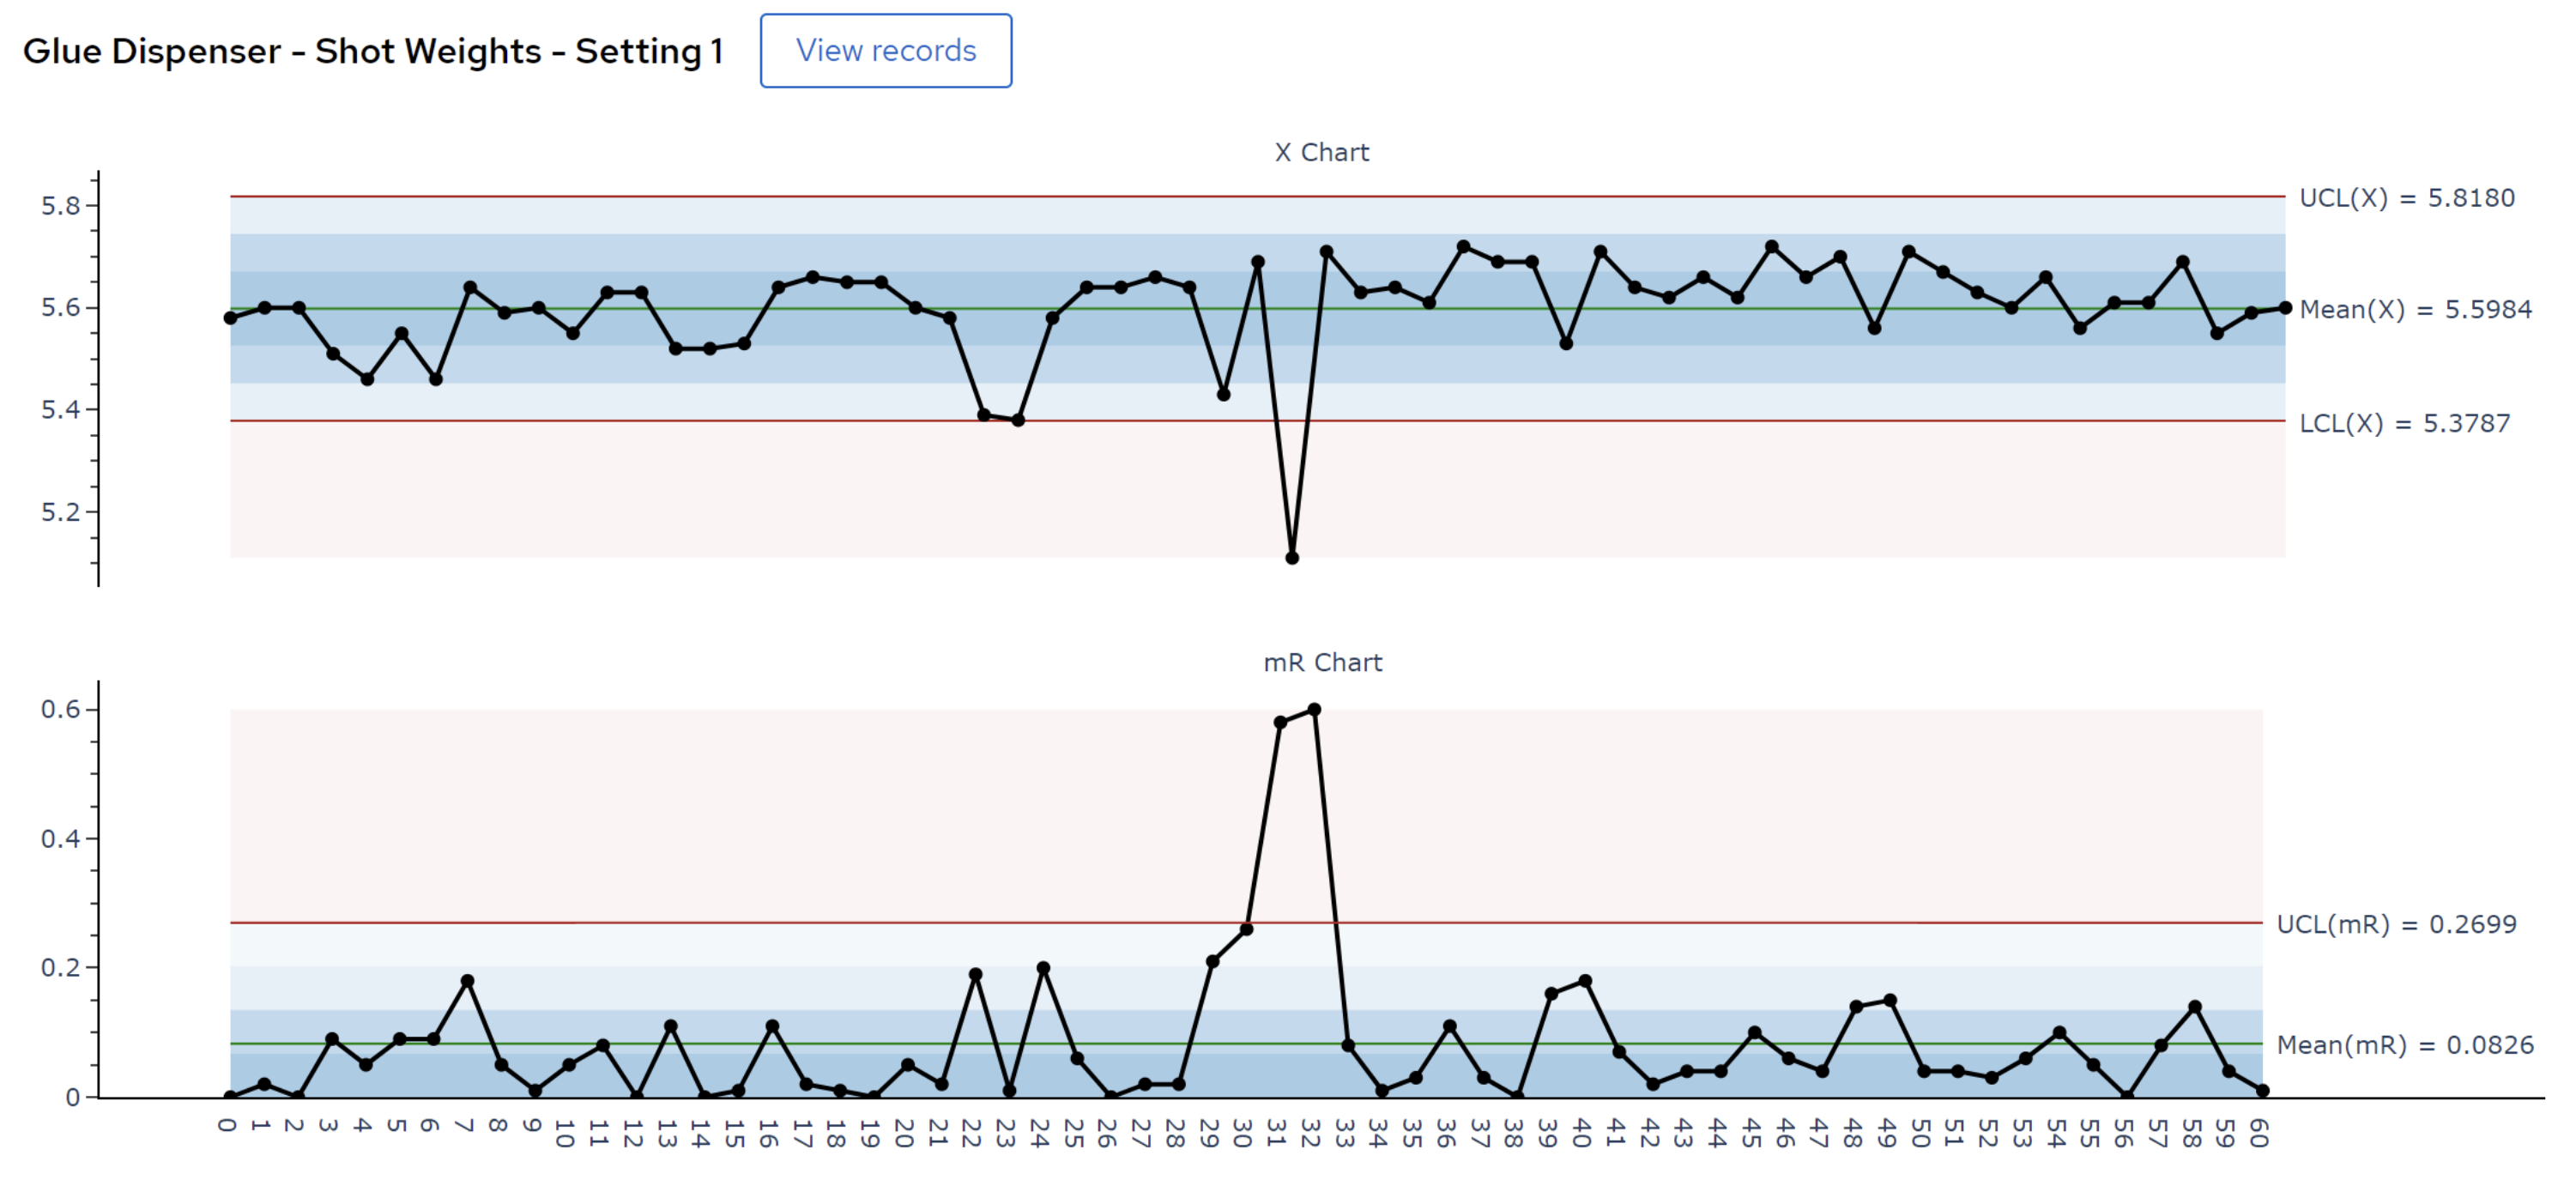
Control charts
Control the process, control the quality
Monitor process variation over time, aiding in identifying trends and out-of-control conditions. Built in AI interprets your control chart, suggests the most appropriate chart type and detects problem signals from your data automatically.
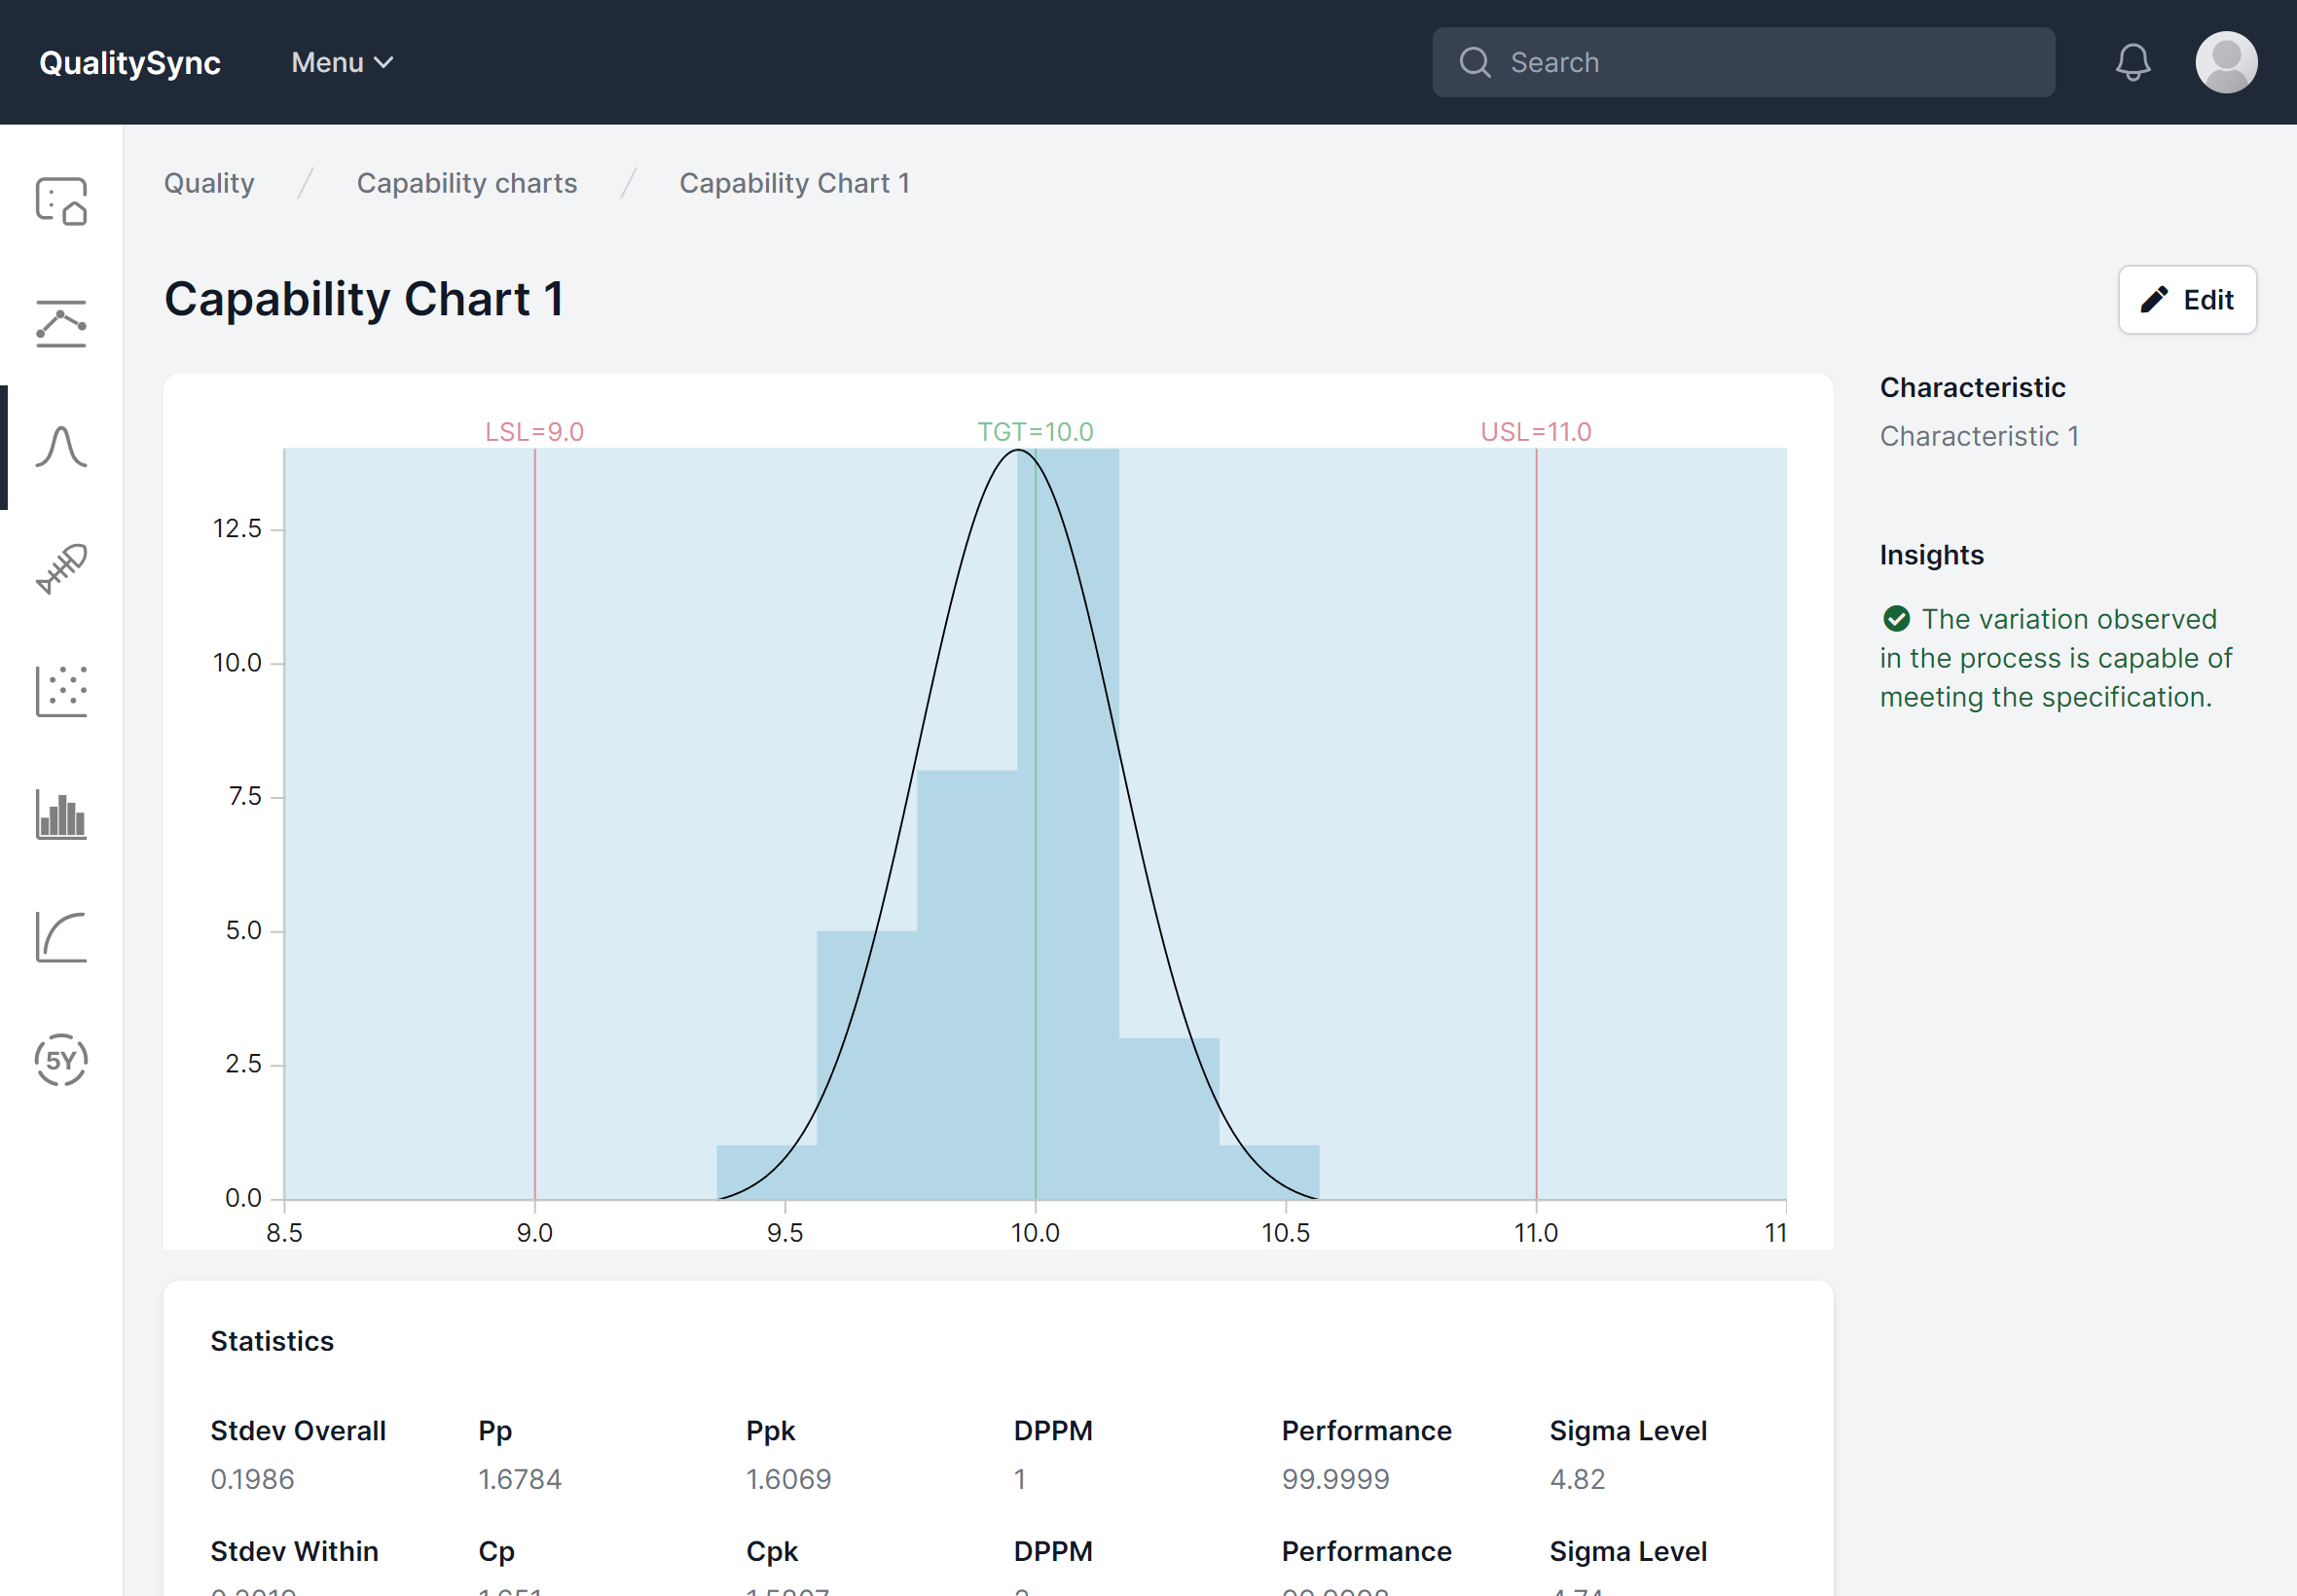
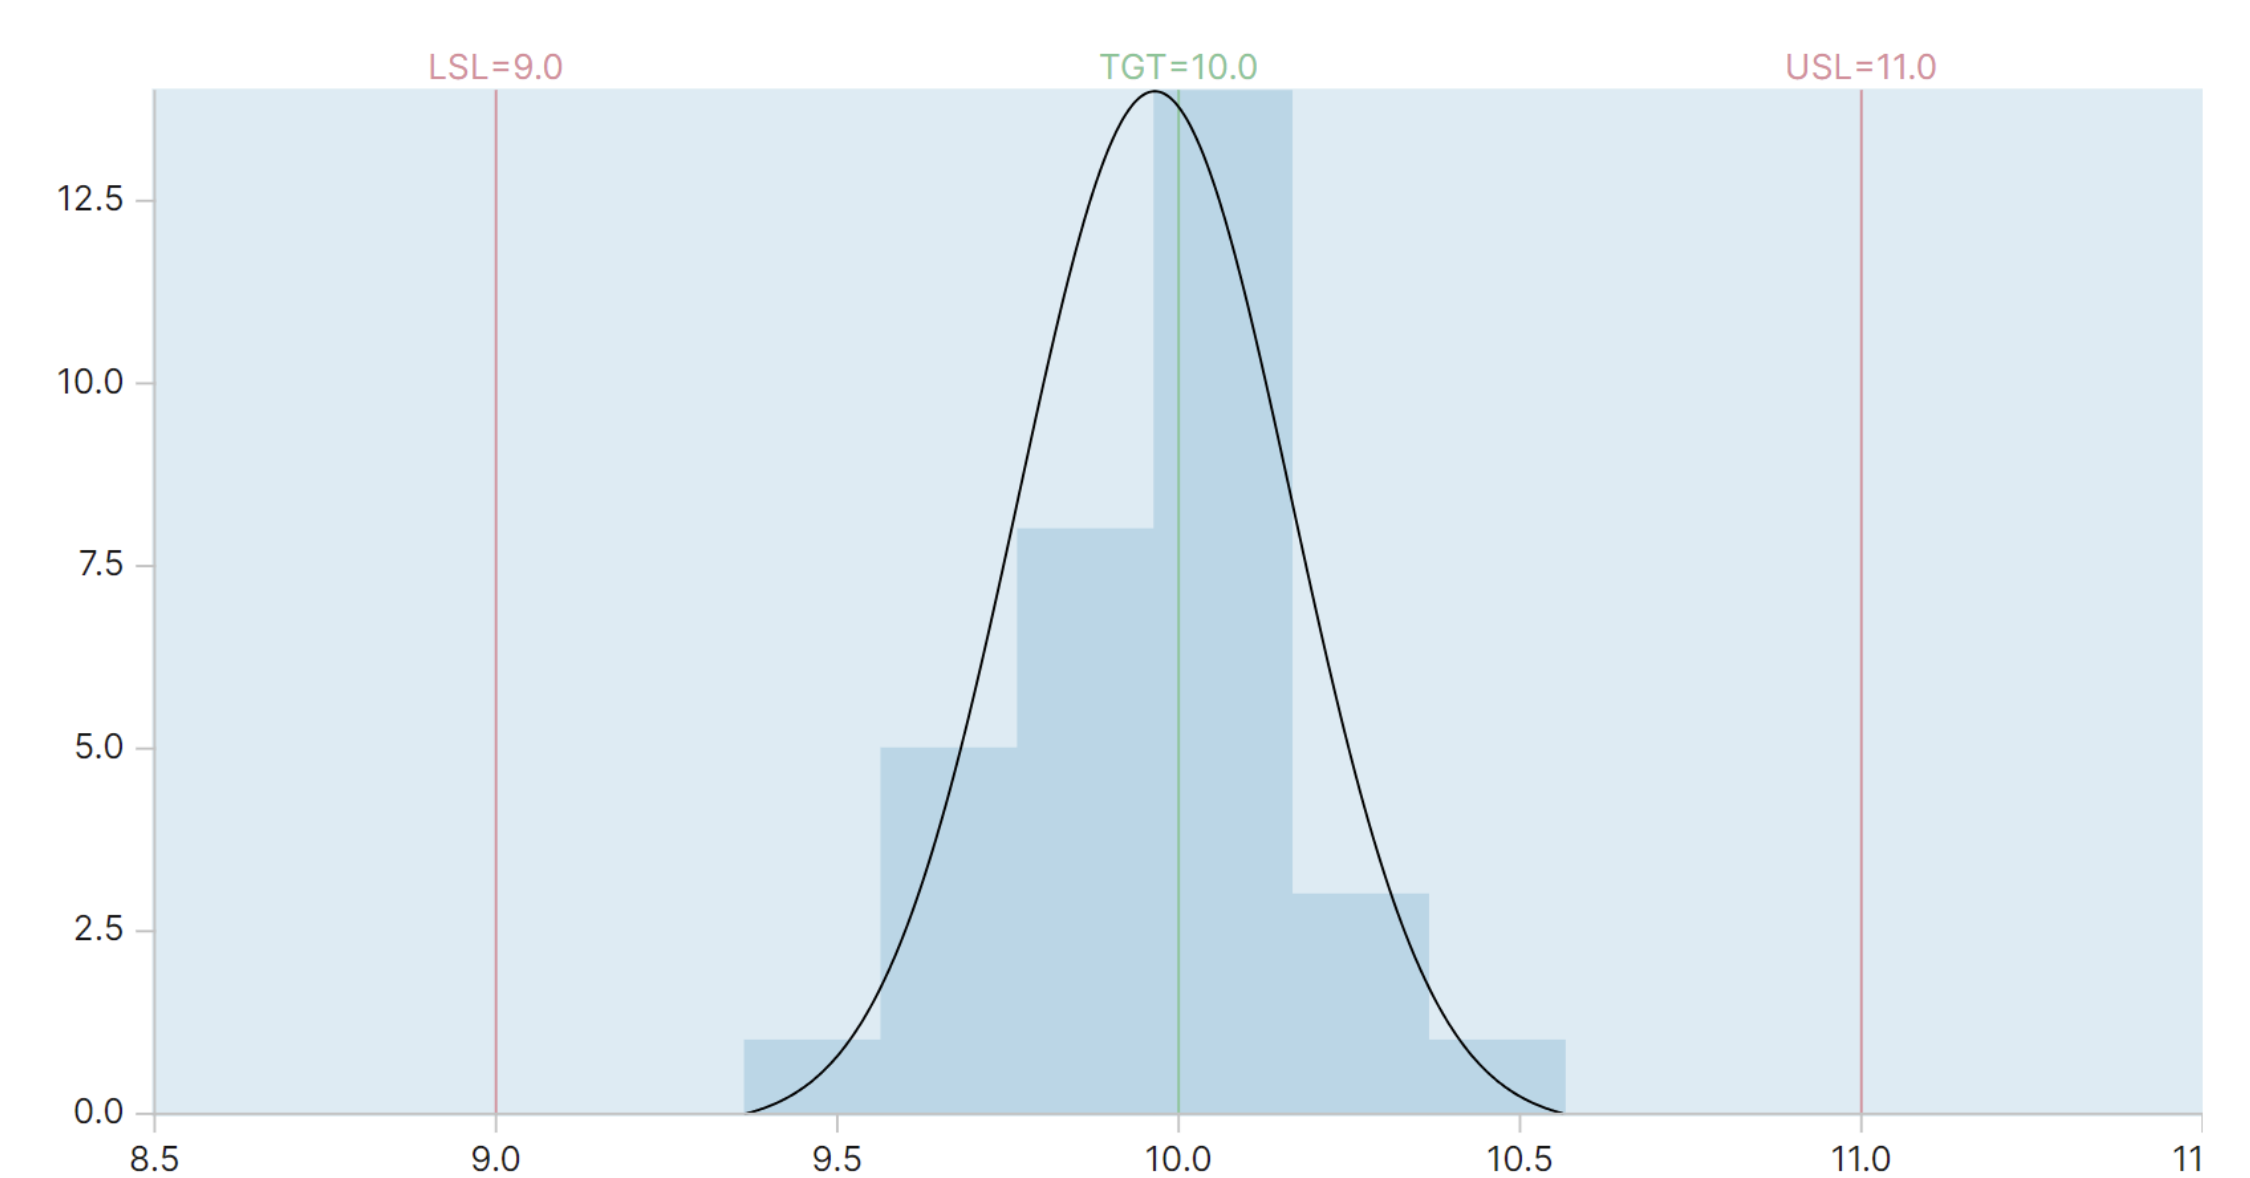
Capability charts
Right first time, every time
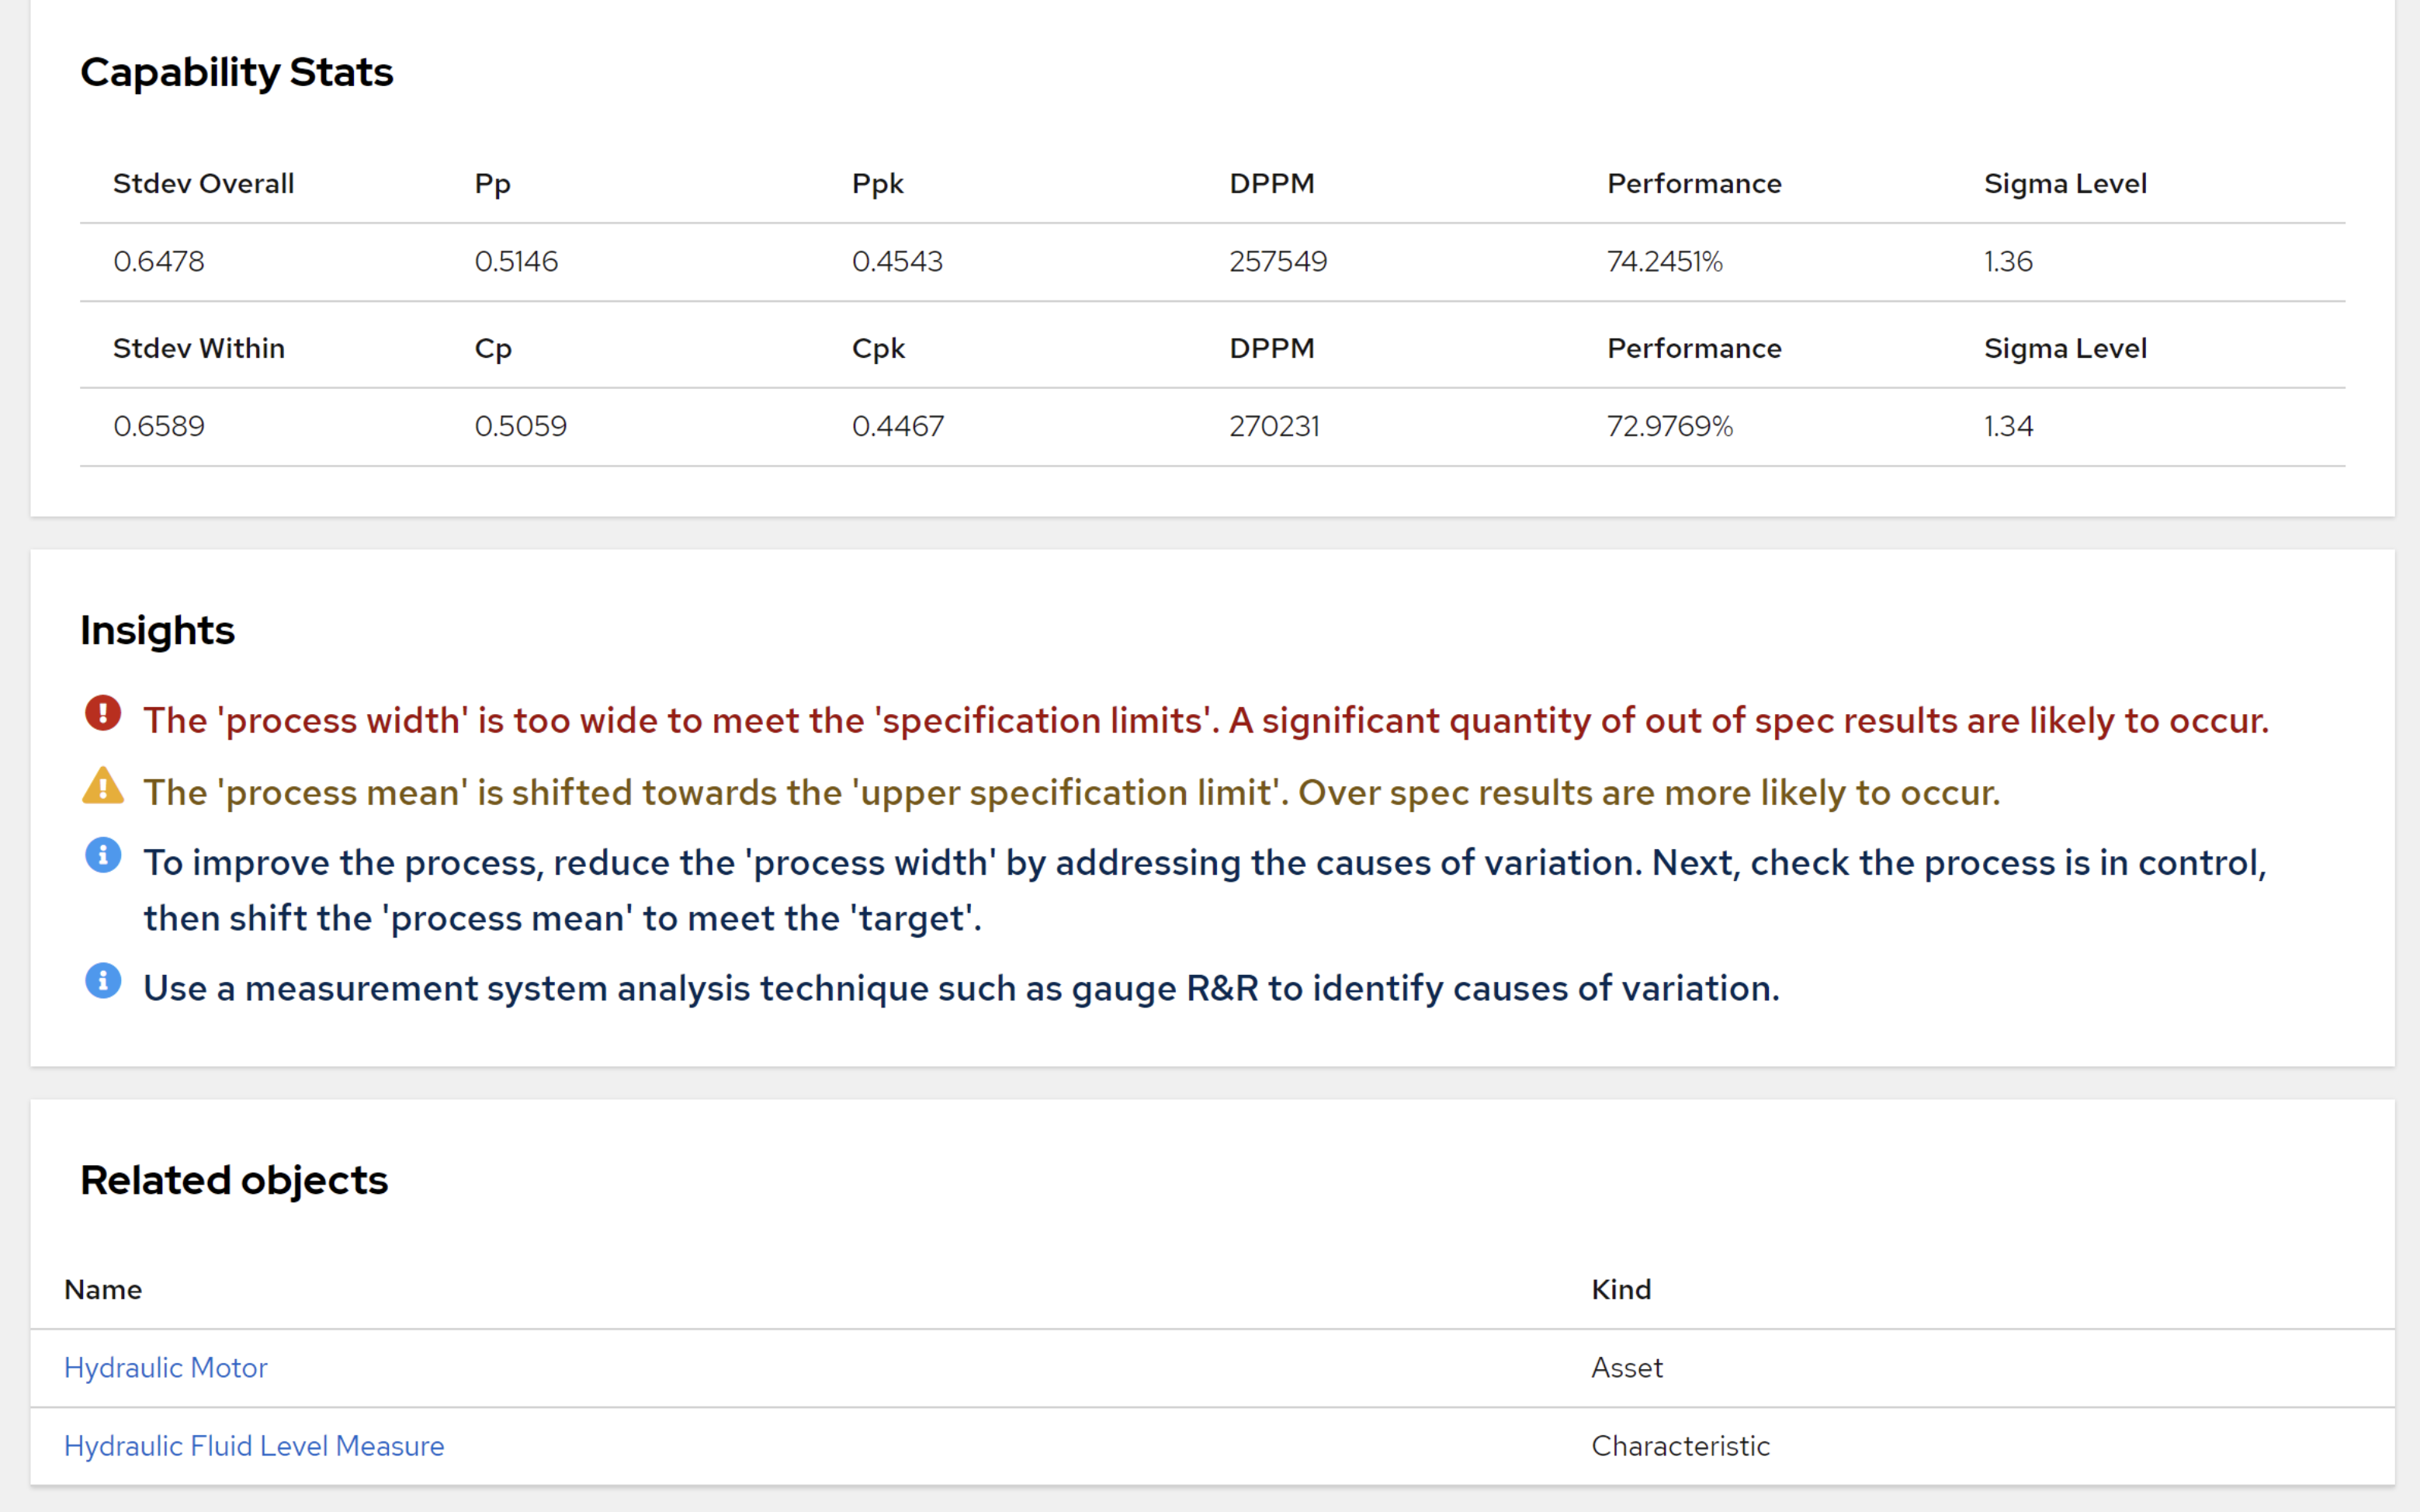
Assess the capability of a process to meet specifications, enabling data-driven decision-making. Built in AI interprets your capability data, provides plain english problem descriptions and makes improvement suggestions.
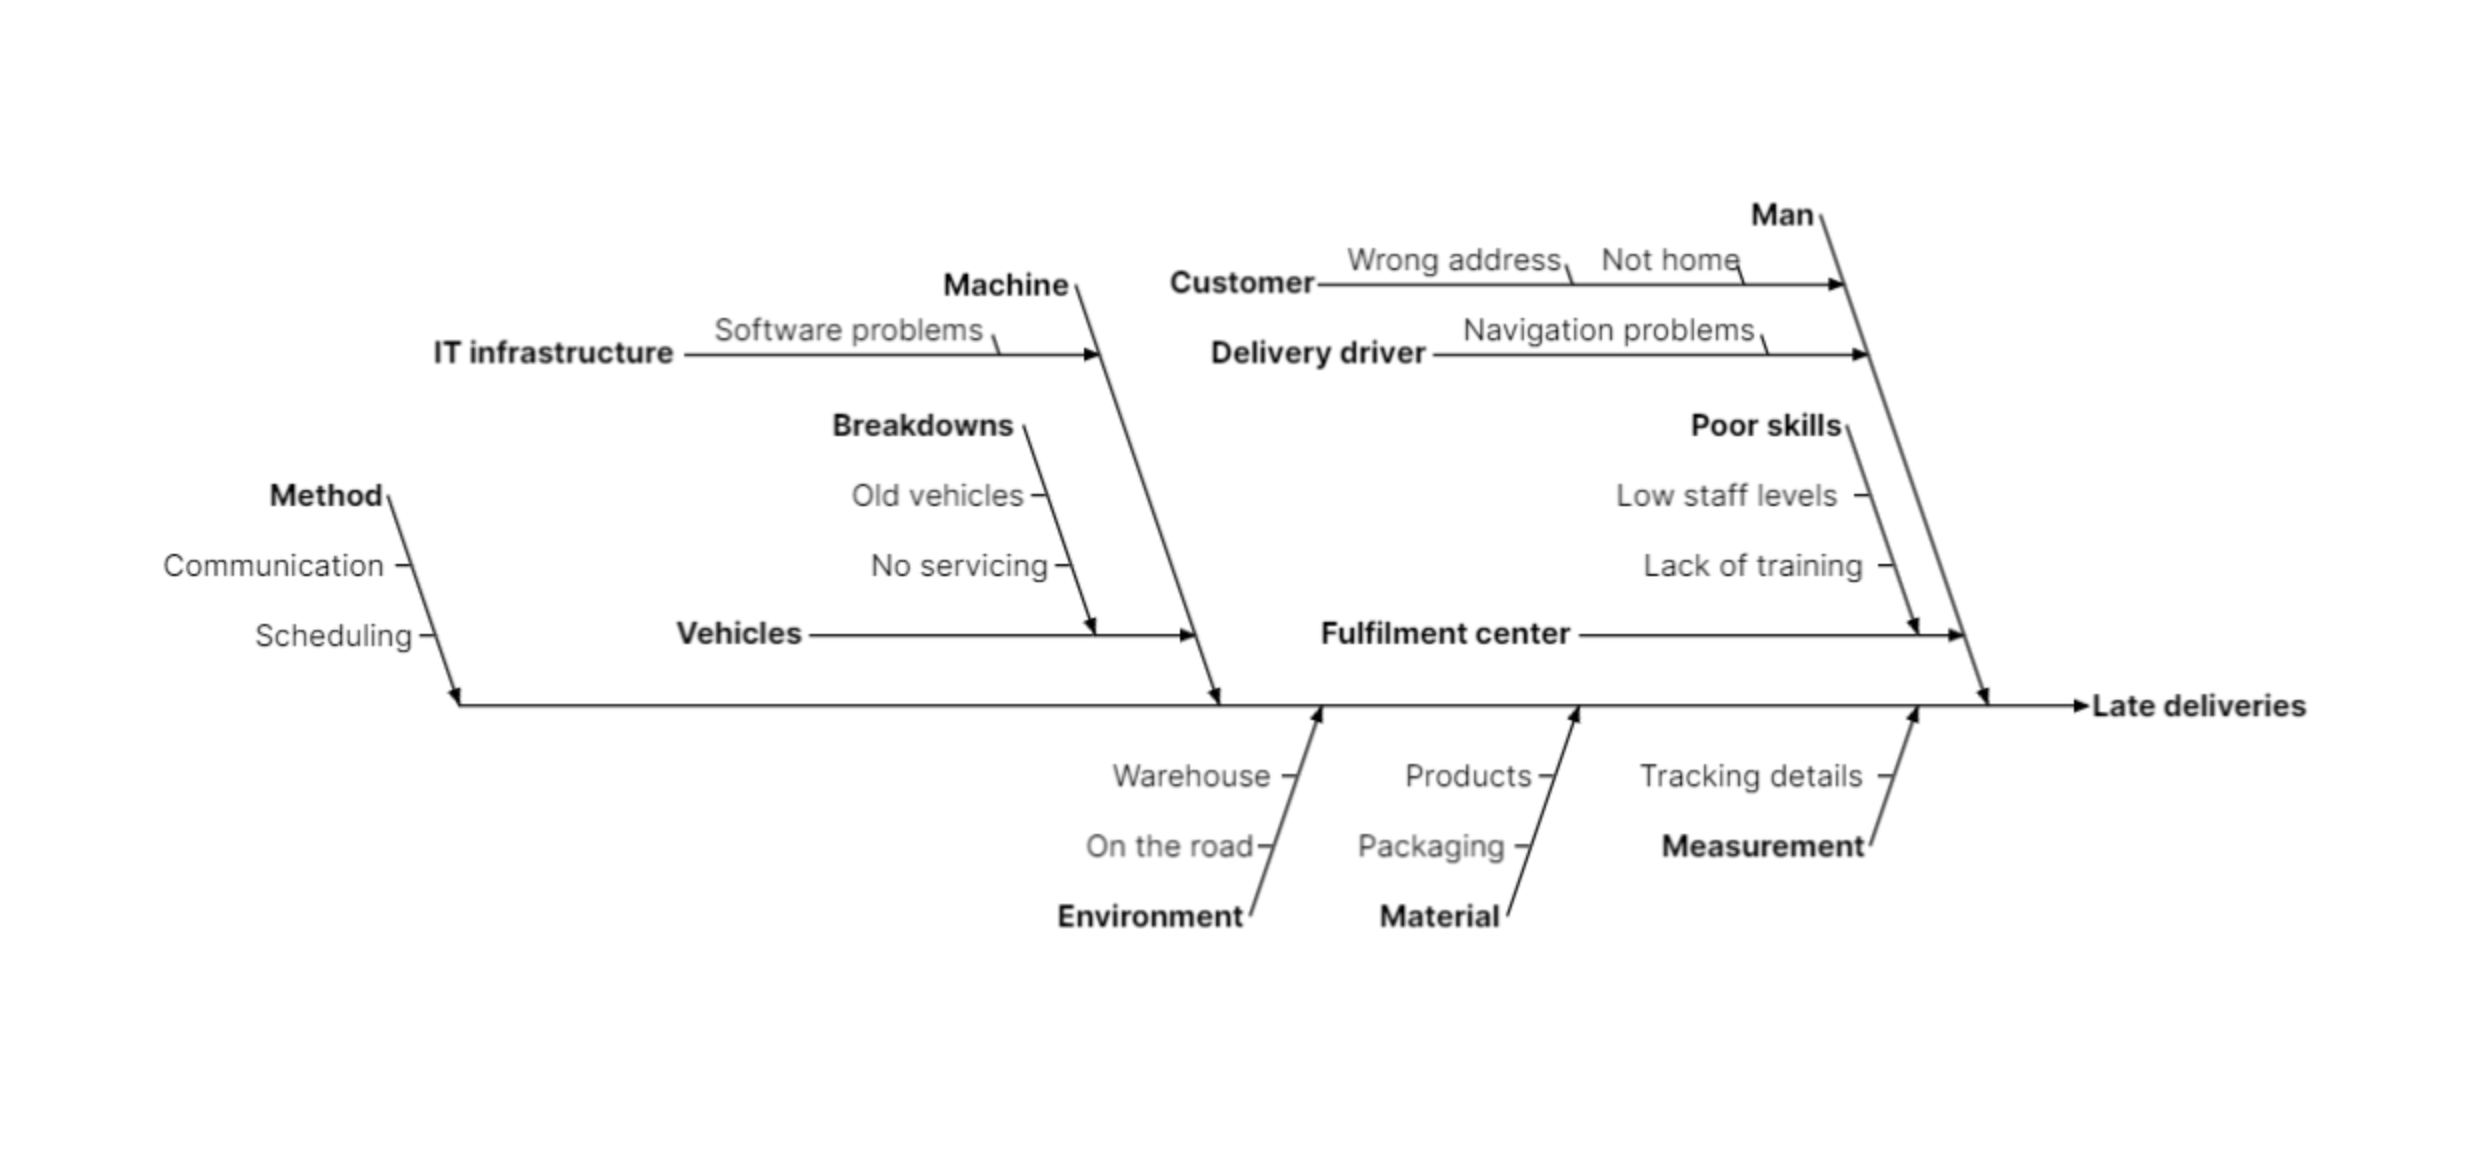
Fishbone
Solve problems like a pro
Visualize root causes of problems, facilitating structured problem-solving and decision-making. Built in AI can help explore and dig deeper into problem spaces when constructing a fishbone diagram.
Control the process, control the quality
Monitor process variation over time, aiding in identifying trends and out-of-control conditions. Built in AI interprets your control chart, suggests the most appropriate chart type and detects problem signals from your data automatically.
Right first time, every time
Assess the capability of a process to meet specifications, enabling data-driven decision-making. Built in AI interprets your capability data, provides plain english problem descriptions and makes improvement suggestions.
Solve problems like a pro
Visualize root causes of problems, facilitating structured problem-solving and decision-making. Built in AI can help explore and dig deeper into problem spaces when constructing a fishbone diagram.

Scatter diagrams
Explore relationships between variables, helping to identify correlations and patterns in data.
Histograms
Illustrate the distribution of data, providing insights into process performance and variability.
Pareto charts
Prioritize issues by displaying the frequency or impact of various factors, guiding focus on critical areas for improvement.
5 whys
Uncover root causes of problems through iterative questioning, enabling effective problem-solving and prevention.
8D
Implement a structured problem-solving approach, facilitating thorough investigation and resolution of complex issues.
Check sheets
Ensure consistency and accuracy in recording process information.
Custom dashboards
Create and share dashboards from your data which automatically update as new data is entered. Any plot or feature within QualitySync can be added to a dashboard.
Data entry terminal
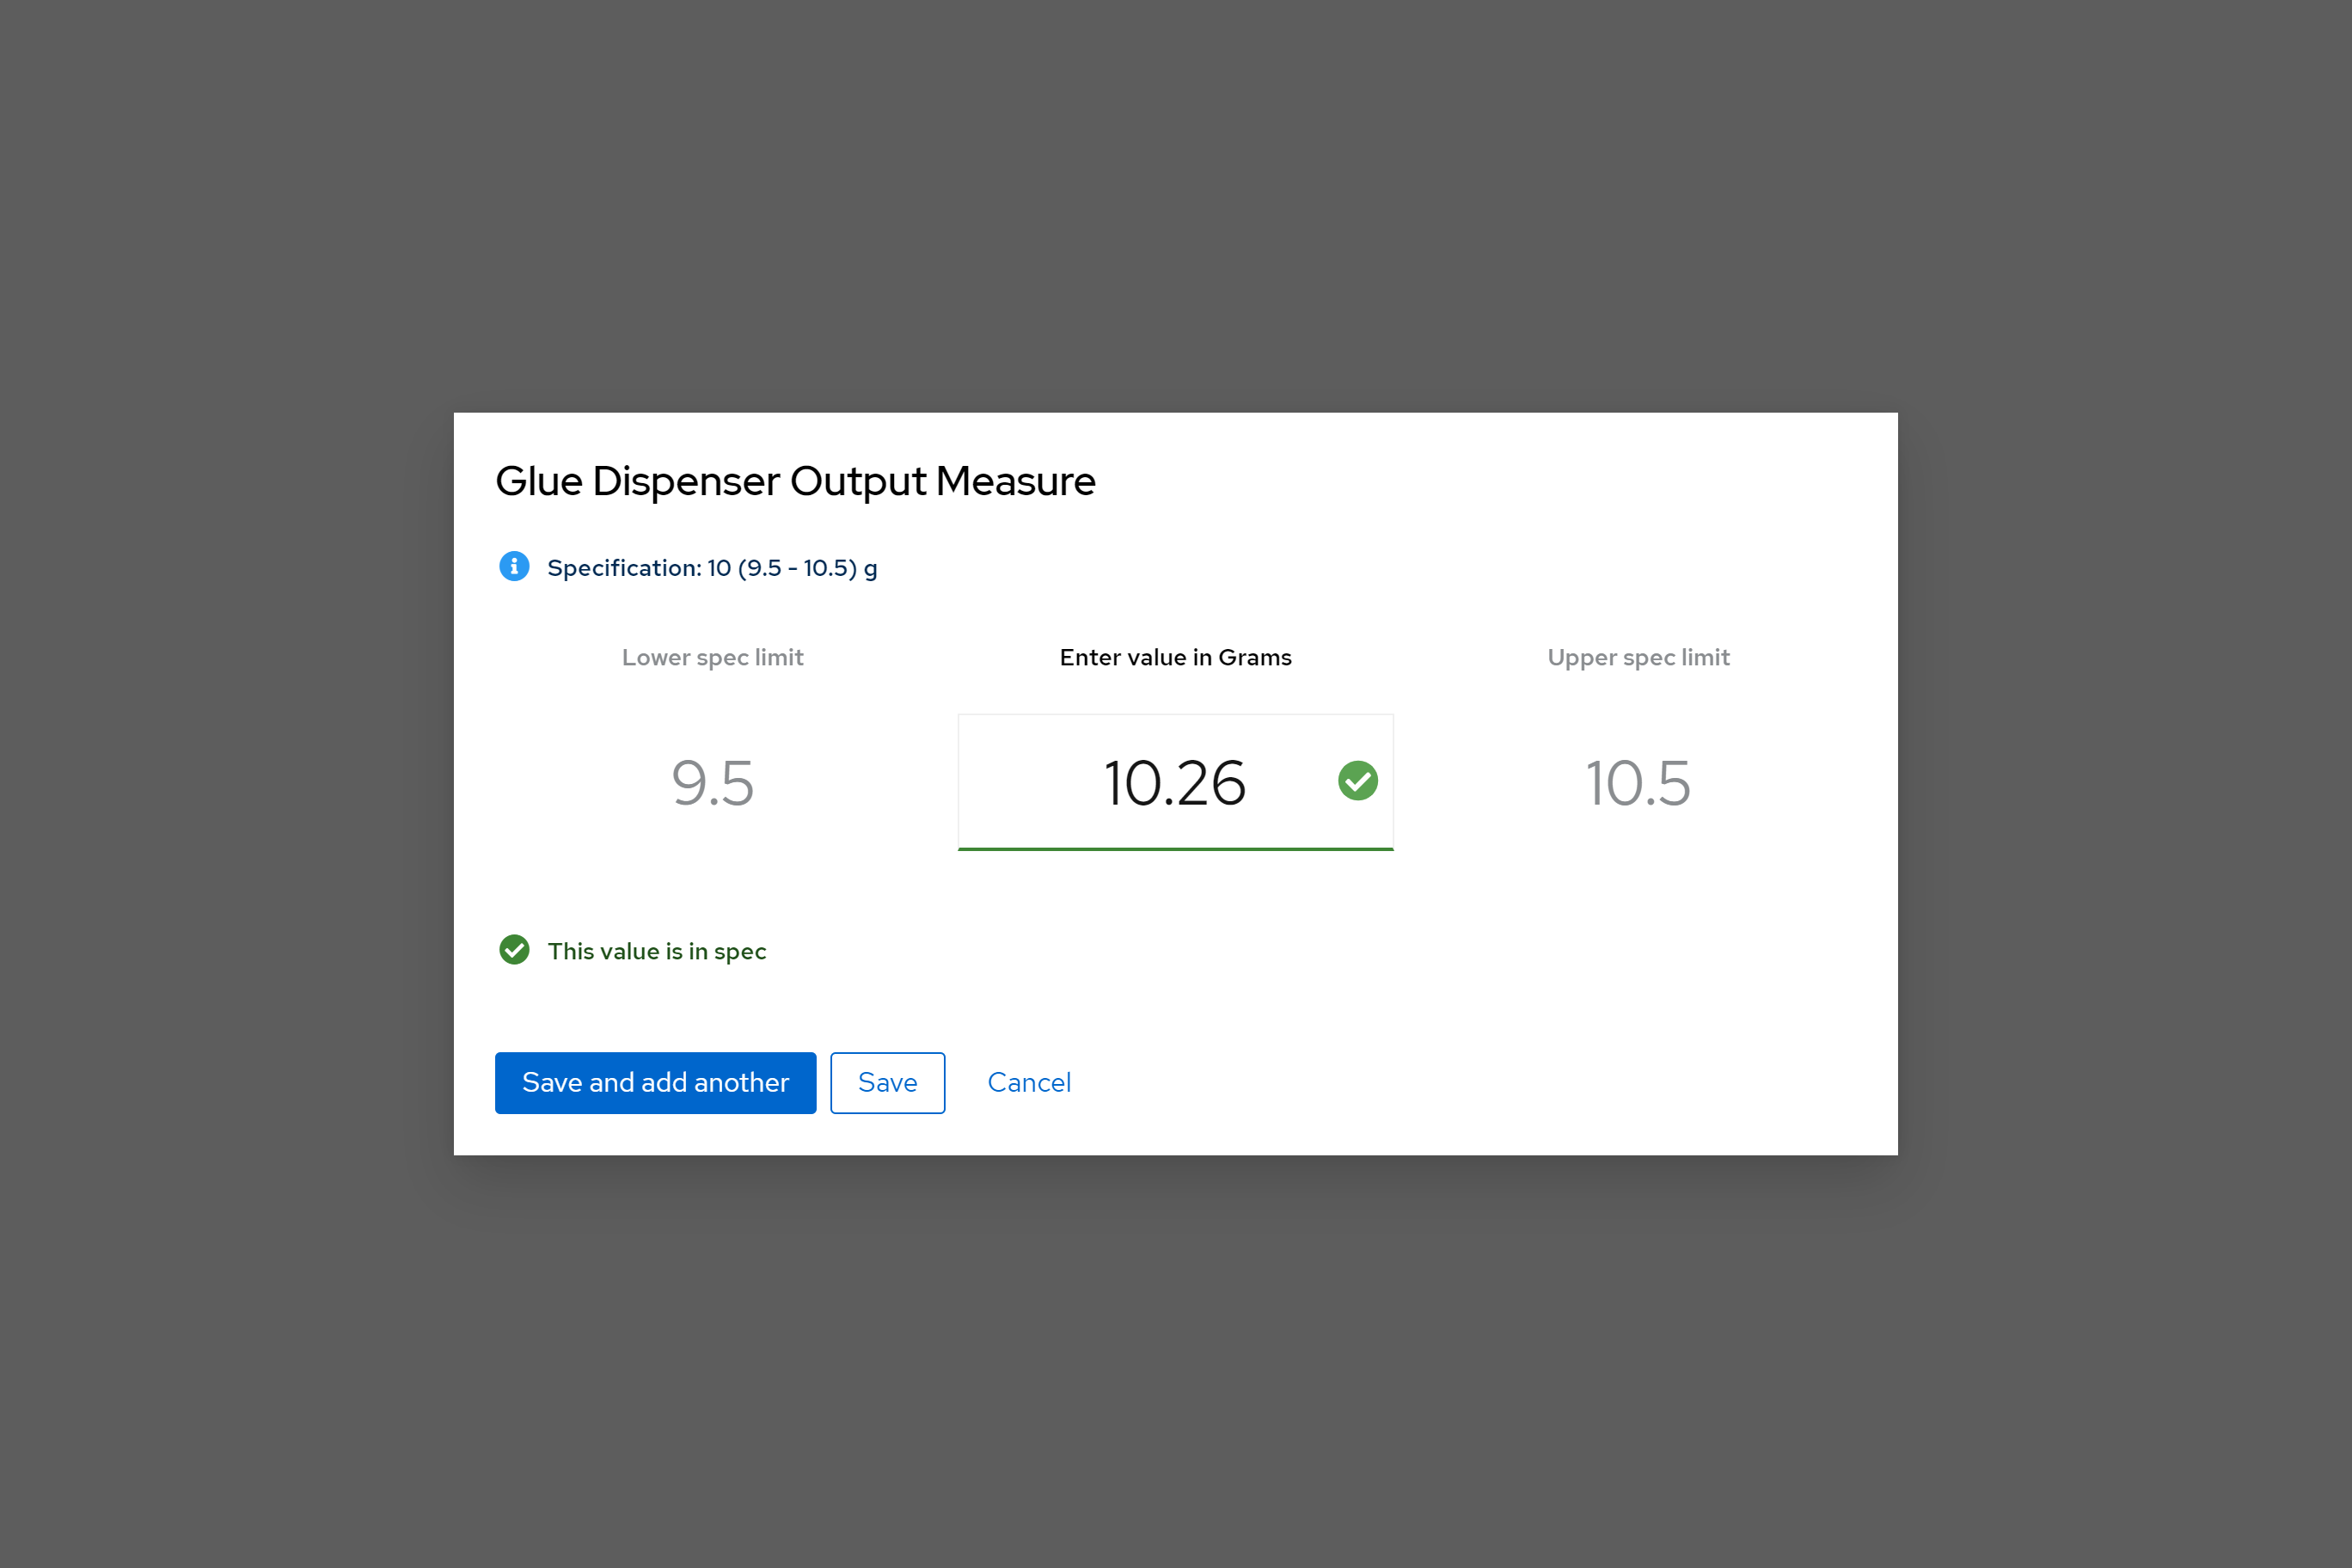
Data entry terminal provides an in the field user interface for collecting data. No longer manually copy data to and from Excel. Involve all staff in quality processes.
User management
Create multiple users with different access levels to your data, with robust access and modification auditing to ensure data integrity

Get started today
Cloud hosted or on-premise, we offer a free trial to demonstrate the return on investment in QualitySync
Get startedFrequently asked questions
Why should I use QualitySync over Minitab or Excel?
QualitySync removes the time and effort required to create charts manually. Our charts connect to your data in realtime, look impressive, and provide insights into what your data is telling you. We want to shift the focus from processing data and creating charts to interpreting data and translating into action.
How easy is QualitySync to use?
QualitySync has zero learning curve. Simply sign up for an account and start collecting and analysing your data straight away. QualitySync guides you through the process and provides key insights based on your data.
Will I be charged based on how much data I collect?
No, our pricing model is not based on usage. Similar platforms offer a lower monthly fee, but the cost rapidly increases the more and more you use it. This means your return on investment significantly decreases over time. We don't believe you should be punished for utilising our platform more. That means with QualitySync, your return on investment only goes up.
Do I need to pay for additional users?
Our licensing model is per site, you can create as many users as you want for each site.
How long does it take to implement?
QualitySync has been designed to be easy enough to self implement and manage. Setup is as simple as walking around your site
Is QualitySync cloud hosted or on premise?
We offer both a cloud hosted version or you can run QualitySync on your own IT infrastructure.
